Our service
Live monitoring and control of your business

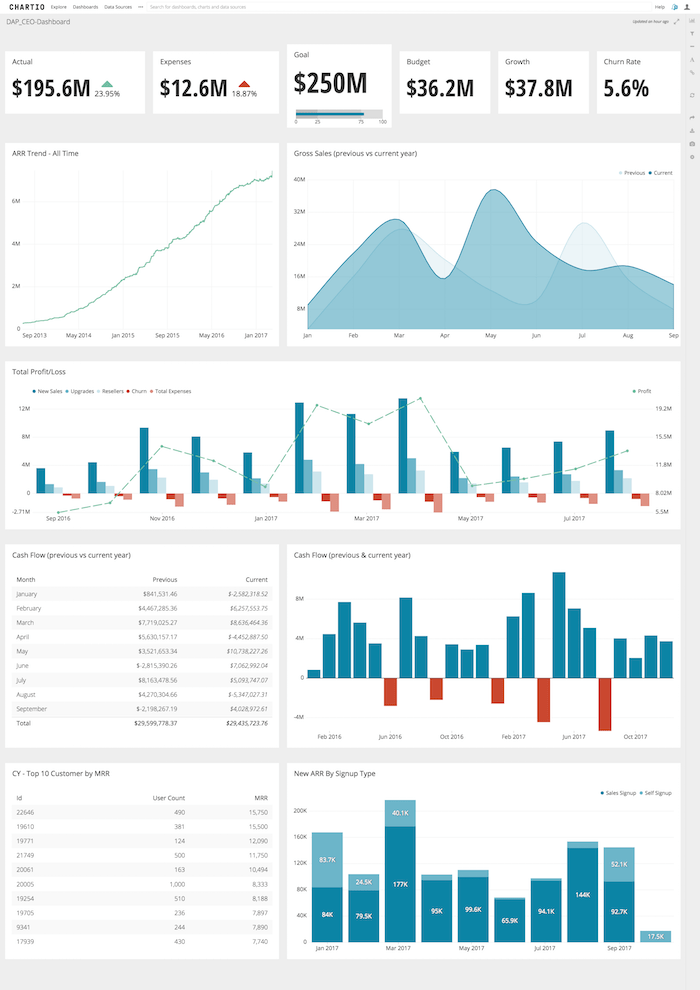
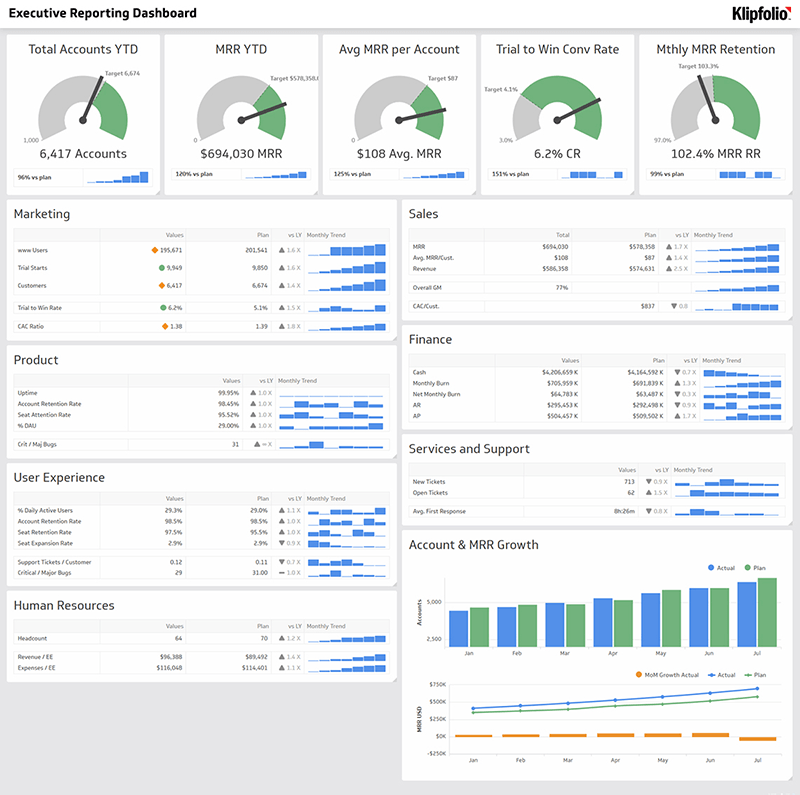
Turning your scatter data into an effective dashboard to monitor your organization performance
Begin your way into the 3-step journey of transforming your data into an interactive dashboard that is capable of changing your business completely.

AMS's Information wealth model
Powerful Insights is Your Data Visualization Service Provider
We Transform your data from regular forms into strategically designed insights, where the light is spotted only on the data that matters!
Empowering your reports with smart designs and eye-opening visuals. Closely highlights the most critical facts and figures that smoothly lead you to make the best decisions

We help in developing Data Analytics Dashboard for Various Industries:
Healthcare:
- Our data analytics dashboard provides healthcare organizations with real-time insights into their operations, allowing them to make informed decisions and improve patient outcomes.
- The dashboard can help track patient satisfaction, resource utilization, and financial performance, providing valuable insights into areas where improvements can be made.
- By visualizing large amounts of data, healthcare organizations can quickly identify trends and patterns, helping them to identify areas of inefficiency and waste, and to develop more effective strategies for patient care.
Manufacturing:
- Our data analytics dashboard provides manufacturers with valuable insights into their operations, allowing them to improve productivity, reduce costs, and increase profits.
- The dashboard can help manufacturers track production schedules, inventory levels, and machine performance, providing real-time data that can be used to optimize their operations and streamline their supply chain.
- By visualizing large amounts of data, manufacturers can quickly identify trends and patterns, helping them to make informed decisions about how to improve their operations and achieve better results.
Finance:
- Our data analytics dashboard provides financial institutions with real-time insights into their operations, allowing them to make informed decisions about how to manage risk, reduce costs, and increase profits.
- The dashboard can help financial institutions track customer behavior, investment performance, and market trends, providing valuable data that can be used to improve their strategies and achieve better outcomes.
- By visualizing large amounts of data, financial institutions can quickly identify trends and patterns, helping them to make more informed decisions about how to manage their operations and achieve their goals.
Hospitality:
- Our data analytics dashboard provides hospitality organizations with valuable insights into their operations, allowing them to improve customer satisfaction, reduce costs, and increase profits.
- The dashboard can help hospitality organizations track guest behavior, room occupancy rates, and food and beverage sales, providing valuable data that can be used to optimize their operations and improve the guest experience.
- By visualizing large amounts of data, hospitality organizations can quickly identify trends and patterns, helping them to make informed decisions about how to improve their operations and achieve better results.
Operations:
- Our data analytics dashboard provides organizations with real-time insights into their operations, allowing them to improve efficiency, reduce costs, and increase profits.
- The dashboard can help organizations track resource utilization, process performance, and supply chain performance, providing valuable data that can be used to optimize their operations and achieve better results.
- By visualizing large amounts of data, organizations can quickly identify trends and patterns, helping them to make informed decisions about how to improve their operations and achieve their goals.
Marketing and Sales:
- Our data analytics dashboard provides marketing and sales organizations with real-time insights into their operations, allowing them to make informed decisions about how to improve their strategies and achieve better results.
- The dashboard can help organizations track customer behavior, marketing campaigns, and sales performance, providing valuable data that can be used to optimize their strategies and achieve their goals.
- By visualizing large amounts of data, organizations can quickly identify trends and patterns, helping them to make more informed decisions about how to improve their operations and achieve their goals.
IT Service Desk:
- Our data analytics dashboard provides IT service desks with real-time insights into their operations, allowing them to improve efficiency, reduce costs, and increase customer satisfaction.
- The dashboard can help IT service desks track ticket volume, resolution times, and customer satisfaction, providing valuable data that can be used to optimize their operations and improve their service.
- By visualizing large amounts of data, IT service desks can quickly identify trends and patterns, helping them to make informed
Transform a corporation’s massive data into meaningful insights is PRICELESS
You have a wealth in your hand, you just need to discover it. Each peace of data from finance department, sales, marketing, information technology, procumbent and human resources can be integrated to form a new insight to your organization and improve your core competency in the market.
Turn your data into money
Find the hidden insight in your data using data mining tools. Data mining tools includes machine learning and deep learning algorithms.
you can benefit from this tools by:
- Prevent cost overruns
- AI for Better Design of Buildings Through Generative Design
- Risk Mitigation
- Project Planning
- AI Will Make Jobsites More Productive
- AI for Construction Safety
- AI Will Address Labor Shortages
- Off-site Construction
- AI and Big Data in Construction
- AI for Post-Construction
- Reducing common, painful process-driven losses e.g. yield, waste, quality and throughput
- Increased capacity by optimizing the production process
- Enabling growth and expansion of product lines at scale due to a more optimized process
- Cost reduction through Predictive Maintenance. PdM leads to less maintenance activity, which means lower labor costs and reduced inventory and materials wastage.
- Predicting Remaining Useful Life (RUL). Knowing more about the behavior of machines and equipment leads to creating conditions that improve performance while maintaining machine health. Predicting RUL does away with “unpleasant surprises” that cause unplanned downtime.
- Improved supply chain management through efficient inventory management and a well monitored and synchronized production flow.
- Improved Quality Control with actionable insights to constantly raise product quality.
- Improved Human-Robot collaboration improving employee safety conditions and boosting overall efficiency.
- Consumer-focused manufacturing – being able to respond quickly to changes in the market demand.


