
| ABSTRACT | |||||||||||||||||||||||||||||||||||||||||||||||||||||||||||||||||||||||||||||||||||||||||||||||||||||||||||||||||||||||||||||||||||||||||||||||||||||||||||||||||||||||||||||||||||||||||||||||||||||||||||||||||||||||||||||||||||||||||||||||||||||||||||||||||||||||||||||||||||||||||||
| Key Performance Indicators (KPIs) are used to evaluate the offensive success of a soccer team (e.g. penalty box entries) or player (e.g. pass completion rate). However, knowledge transfer from research to applied practice is understudied. The current study queried practitioners (n = 145, mean ± SD age: 36 ± 9 years) from 42 countries across different roles and levels of competition (National Team Federation to Youth Academy levels) on various forms of data collection, including an explicit assessment of twelve attacking KPIs. 64.3% of practitioners use data tools and applications weekly (predominately) to gather KPIs during matches. 83% of practitioners use event data compared to only 52% of practitioners using positional data, with a preference for shooting related KPIs. Differences in the use and value of metrics derived from positional tracking data (including Ball Possession Metrics) were evident between job role and level of competition. These findings demonstrate that practitioners implement KPIs and gather tactical information in a variety of ways with a preference for simpler metrics related to shots. The low perceived value of newer KPIs afforded by positional data could be explained by low buy-in, a lack of education across practitioners, or insufficient translation of findings by experts towards practice. | |||||||||||||||||||||||||||||||||||||||||||||||||||||||||||||||||||||||||||||||||||||||||||||||||||||||||||||||||||||||||||||||||||||||||||||||||||||||||||||||||||||||||||||||||||||||||||||||||||||||||||||||||||||||||||||||||||||||||||||||||||||||||||||||||||||||||||||||||||||||||||
| Key words: Football, soccer, match analysis, performance analysis, applied data-science | |||||||||||||||||||||||||||||||||||||||||||||||||||||||||||||||||||||||||||||||||||||||||||||||||||||||||||||||||||||||||||||||||||||||||||||||||||||||||||||||||||||||||||||||||||||||||||||||||||||||||||||||||||||||||||||||||||||||||||||||||||||||||||||||||||||||||||||||||||||||||||
Key Points
|
|||||||||||||||||||||||||||||||||||||||||||||||||||||||||||||||||||||||||||||||||||||||||||||||||||||||||||||||||||||||||||||||||||||||||||||||||||||||||||||||||||||||||||||||||||||||||||||||||||||||||||||||||||||||||||||||||||||||||||||||||||||||||||||||||||||||||||||||||||||||||||
In the domain of performance analysis in soccer, analyst and research teams support staff members with information primarily to enable understanding of performance, and to improve training regimes and decision-making. More specifically, many high-level soccer teams employ key performance indicators (KPIs) regularly to measure and increase tactical performance. KPIs are quantifiable measures used to evaluate the success of an organization, team, employee, or athlete, in meeting objectives for performance. In soccer, KPIs have been combined with video analysis to inform practice (Groom et al., 2011; Wright et al., 2012) and evaluate the success of a team (Jones et al., 2004; Ruiz-Ruiz et al., 2013) or player (Król et al., 2017). In recent years the complexity and predictive power of KPIs increased tremendously as several authors reported a direct link between offense-related KPIs and match performance in elite soccer (Kempe et al., 2016; Perl and Memmert, 2017; Yang et al., 2018). Despite these findings, there is a gap in knowledge transfer and usage between research and practice (Mackenzie and Cushion, 2013). This lack could be due to coaches primarily selecting KPIs based on their coaching philosophy and ‘gut instinct’ more so than the scientific literature (Wright et al., 2012). Another explanation could be that coaches favor qualitative methods such as subjective scouting reports (e.g. video analysis) over quantitative approaches (Nelson and Groom, 2012). In opposition to these preferences, there has been an exponential increase in the human capital invested in soccer research and analytics in recent years (Goes et al., 2020; Rein and Memmert, 2016a). This indicates that different stakeholders of a club or federation value, use, and implement KPIs differently. However, to date, no study has attempted to close or explain this gap between research and practice by investigating the perception and implementation of KPIs used by high-level soccer practitioners in their daily activities. In principle, KPIs can be distinguished by their source of data being derived either from event data, positional data, or both. The use of event data, based on notational analysis, is a commonly used method to quantify and evaluate individual and team performance (Lago-Peñas and Dellal, 2010; Sarmento et al., 2014). Event data consists of individual actions (e.g. passes, shots, or tackles) assigned to one or more players. Basic measures such as frequencies, proportions, and other accumulated performance indicators of events happening throughout a match are commonly used in a team’s evaluation process (Lago-Peñas and Dellal, 2010). Examples of such key behaviors include penetrating the defense (Tenga et al., 2017) and teams prioritizing the quick (10s or less) regain of ball possession (Vogelbein et al., 2014). KPIs gathered with event data have continued to evolve into higher value metrics such as expected goals (xG)(Lucey et al., 2014; Rathke, 2017), a predictive model used to assess every shot and the likelihood of scoring. Although event data are valuable in supporting tactical principles and identifying key game events; they fail to account for temporal and spatial interactions of players and sequences of actions between teammates and opponents (Garganta, 2009; Vilar et al., 2012). An additional challenge of event data is coming to a global agreement on a standardised set of key performance indicators (Carling et al., 2014), as experts often use slightly different definitions of the same event. Technological advancements have led to new possibilities, allowing practitioners the ability to measure KPIs using automatic tracking systems, including video-based motion analysis, Global Positioning System (GPS) units (Carling et al., 2008) or Local Positioning Measurements (LPM) (Frencken et al., 2010). This concurrent technology integrated with data science approaches produces a range of variables enabling practitioners to quickly quantify actions on the pitch and create new KPIs and visualizations in greater detail (Herold et al., 2019; Perin et al., 2018; Yue et al., 2008). By including time and space and/or player interactions, these KPIs enrich event data with context and provide evidence-based information to coaches and analysts (McLean et al., 2017; Memmert and Perl, 2009). For instance, Goes et al., (2019) combined xG with defensive pressure to create a zone metric for pass receivers that was significantly higher in winning teams compared to losing teams (Goes et al., 2019). Though soccer is a rather complex and unpredictable sport, the use of tracking data could accurately predict the match outcome in this study. Whilst the quality of positional data has improved, there are still challenges around the precision of the information provided by tracking data relative to what is occurring on the pitch (Linke et al., 2018). Moreover, these mathematically based measures need further refining to be represented in a way that can be understood and utilized in practice (Drust and Green, 2013). Practitioners vary in their definition of success and might be interested in different indicators based on their preferred game style and formation (Meerhoff et al., 2019; Memmert et al., 2017). Also, tactical analysis has increased in complexity (Rein and Memmert, 2016b) and the sophistication of KPIs has grown substantially since earlier key work on performance analysis (Nelson and Groom, 2012; Wright et al., 2013). Elite soccer clubs and federations consist of large backroom staff sizes (e.g. data scientists, performance analysts, strength and conditioning coaches, etc.) and tasks around performance analysis are widespread. Thus, there is a need for a more novel approach that provides a comprehensive overview of how diverse staff members from various levels of competition use and value KPIs. For example, it was expected that analysts at the professional level who specialize in tactical play would be more likely to use the modern and higher value KPIs compared to coaches or practitioners from levels where the outsourcing of tasks is not possible. Although elite and professional teams have been reluctant to share information in the past, recent research has shown an increased willingness to facilitate the applications of those scientific findings (Ric et al., 2017). Accordingly, providing insight into the current practices and perceptions of KPI utilization will serve to highlight the challenges faced by practitioners and stimulate further industry-relevant applied research. Therefore, the current study aims to depict the status quo of attacking KPIs and provide a current perspective and practices in high-level soccer. To achieve this aim, a questionnaire of KPIs calculated based on event and positional tracking that are frequently mentioned in the literature or offered by commercial parties will be conducted. As defensive KPIs have not received extensive scientific attention thus far, the focus of this research remains on attacking parameters. The questionnaire will be shared with high-level coaches, assistant coaches, match analysts and scouts, and directors, to gain insight into the state of the art in the usage of KPIs.
Participants
The present research fully complies with the highest standard of ethics and participant protection which followed the guidelines stated in the Declaration of Helsinki (2013) and was approved by the Saarland University ethics committee. Following these guidelines, before completing the survey, participants received information about the purpose of the study and gave their informed consent for participation. A round of in-person pilot testing and a second-round online with thirty-five experts was performed prior to the beginning of the study to assess the face validity of each question. In addition, the pilot testing was used to ensure explanations provided for every KPI were understood. This was important as not every practitioner might be familiar with each KPI, or they may use different terminology within their club or federation. The survey was conducted online using Google Forms.Participants were asked to specify their role as either a Director (technical director or director of coaching), Coach, Assistant Coach, Analyst, or Scout. Eligibility criteria specified that if the participant was a Director, Coach, or Assistant Coach, the respondent should have a minimum of a UEFA B License or the equivalent to be a representative of the final testing cohort. However, if the participant was an Analyst or Scout, it was unnecessary that they had a license. All Analysts and Scouts were included in the final cohort as many of these practitioners’ do not have a coaching license, but a specific degree that varies broadly between federations. The level that participants worked was incorporated as an inclusion criterion. These included participants at the Federation level (men’s national teams), the Professional level which included the top tier and second-tier league for each country (except the UK and Germany where the third and fourth leagues are considered professional, and Italy where the third league is considered professional), the Semi-Professional level, the Youth Academy level (the youth sector of top tier or second-tier professional clubs), and College soccer (NCAA Division I and II). Based on these criteria, seven out of the 152 responses were excluded from the final analysis as they either did not meet the minimum requirements or failed to provide adequate information. Procedure
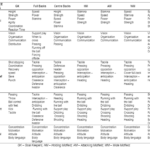
An invitation to participate was e-mailed to a member of the coaching staff or match analysis department of each of the invited clubs from a personal network. The survey was uploaded to Google Forms. All responses were voluntary and anonymous. Respondents were provided with the link, and once a respondent had submitted the survey, they could not respond again. If no response was received within two weeks of the initial invitation, a second reminder email was sent. A third reminder email was sent in the event of no response after four weeks of the second message. If no response was received to the third message, a classification of “no response” was assigned.Question development was guided with findings from a review of the literature exploring the most common KPIs differentiating between winning and losing teams, and expert experience from match analysts at the German Football Association (DFB = Deutscher Fussball-Bund). The inclusion of practitioner interaction ensured the validity of the questionnaire content (Stoszkowski and Collins, 2016). This approach followed the examples of other questionnaire development in football (Akenhead and Nassis, 2016; Weston, 2018; Wright et al., 2012). The use of multiple-choice questions, checkboxes, and Likert scales have shown to be valid ways to gain insight into current practice and perceptions among football practitioners (Brink et al., 2018; Weston, 2018). The Likert scale contained response labels as per Vagias (2006) (Vagias, 2006) and within the main part of the questionnaire, practitioners were asked to rank how strongly they agree or disagree about the value of different indicators using a 7-point Likert scale (with 1 being “strongly agree”, 2 “agree”, 3 “slightly agree”, 4, “neutral”, 5 “slightly disagree”, 6 “disagree”, and to 7 being “strongly disagree”) and to what extent they use the indicator in their practice. The survey was divided into three parts. First, participants were asked general questions about their role, country of employment, years of experience, age, level of competition, and coaching license. In the second part, they answered a block of questions on the general frequency of usage of KPIs (daily, weekly, monthly, or seasonally) and the availability and usage of digital (data) tools to gather event data, optical tracking data, and the use of wearable devices. The third and main part of the survey asked for the usage of each KPI and field of application (match analysis, training analysis, or both) followed by a ranking of twelve KPIs (see Table 1 and Table 2). The list included nine KPIs derived from event data and three KPIs gathered with positional tracking data. Two of the KPIs, Ball Possession Metrics and Pass Evaluation Metrics, each had sub-metrics that were further analyzed. Table 1. Definition of KPIs calculated based on Event Data and references linking them to success in soccer (references list up to the four most recent articles).
Table 2. Definition of KPIs calculated based on positional tracking and references linking them to success in soccer (references list up to the four most recent articles).
Statistical analysis
Chi-square tests were utilised to examine differences between roles (“Coach” versus “Assistant Coach” versus “Analyst and Scouts” versus “Directors”) and levels of competition (“Federation” versus Professional” versus “Semi-Professional” versus “Youth Academy” versus “College”) for the specific use of the KPIs. Next, to examine differences between roles and levels of competition for KPI rankings there were outliers in the data as assessed by inspection of a boxplot. Therefore, it was determined a Kruskal-Wallis H Test would be more appropriate. Using a Krustal-Wallis H Test for level of competition and KPI rankings, pairwise comparisons were performed using Dunn’s (1964) procedure with a Bonferroni correction for multiple comparisons. Adjusted p-values are presented. Values are mean ranks unless otherwise stated. Based on Ferguson’s recommendations for effect size, strength of association indices (e.g., Cramer’s V for chi-square and ε² for Kruskal-Wallis H Test) were considered practically significant when V ≥ .20 and ε²≥.04 (Ferguson, 2009).
Background of practitioners
In total, 145 participants (mean ± SD age: 36.2 ± 9.3 years) completed the survey. Subsequently, survey respondents included 42 different countries with most of the participants from the USA (26) and Germany (16), followed by England (10), Portugal (10), Italy (8), and the Netherlands (7). Coaches represented the largest sample followed by Analysts and Scouts, with almost half of all participants working at the Professional level. (See Table 3). Table 3. Practitioner breakdown by Level of Competition and Role.
Use of TechnologyGeneral use of data tools Of the listed data tools and applications, 37% of participants reported no use, while 17% use tools and applications not listed (e. g. Longomatch). Differences between roles for the use of different data tools and applications were significant (p = 0.04, V = 0.41). Although no statistically significant difference (p = 0.22) was found between levels of competition, a moderately strong association and practical significance (V = 0.37) was found. 63% of Semi-Professionals and 40% of Youth Academy practitioners reported no use of data tools and applications at all compared to just 33% of Federation, 30% of Professionals, and 29% of College practitioners. Metrics/KPIs based on event data
Overall, 83% of participants reported the use of event data technology. 35% of participants reported using their own tagging using platforms such as Hudl or Sportscode rather than relying on external sources such as Stats Perform, or official league sources such as Bundesliga Event Data. There was a significant difference (p = 0.006, V = 0.30) between level of competition for the use of KPIs derived from event data with practitioners from Federations and the Professional level reporting greater use. There was no significant difference (p = 0.38, V = 0.21) between roles for the use of event data technology. Metrics/KPIs based on optical positional tracking
Among the practitioners using optical positional tracking data, there was no evidence of one preferred tool. Over half of the participants (75=52%) did not use any positional tracking regularly. No significant differences between role (p = 0.38, V = 0.26) or level of competition (p = 0.70, V = 0.23) for the use of positional tracking were found. However, findings showed small levels of practical significance for both with a trend for greater use at higher levels. Metrics/KPIs based on wearable technology
67% of participants reported the use of wearable technology. Catapult (19%) and STAT Sports (19%) were the most commonly used wearable devices. The differences between roles for the use of wearable technology approached significance (p=.055, V=.34), and there was no significant difference between levels of competition for the use of wearable technology (p = 0.25, V = 0.30). Differences for both role and level of competition showed small practical significance. Frequency of KPI use
The most utilized KPIs were related to shooting, whilst the least used were the passing and possession-based metrics that depend on positional tracking (see Figure 1). Almost half of the participants (45%) reported the use of KPIs on a weekly basis, although 58% of practitioners from the Federation level reported using KPIs daily (Figure 1). This may reflect the different scheduling between national versus club teams. 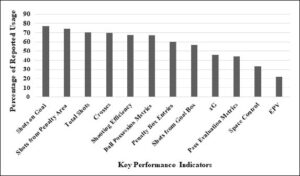 Use of KPIs for matches, training, or both training and matches
It was reported that 35% of practitioners use KPIs for matches, while 19% use them for both training and matches, and only 3% for training alone. Significant differences were only found between roles for Ball Possession Metrics (p = 0.04, V = 0.20) and Pass Evaluation Metrics (p = 0.04, V = 0.20). There were no significant differences found between levels of competition (p = 0.07 to 0.99, V = 0.11 to 0.23). Use and value of the different KPIs
The five most used KPIs were Shots on Goal (77%), Shots from Penalty Area (73%), Total Shots (70%), Crosses (70%), and Shooting Efficiency (68%). The bottom five KPIs included Shots from the Goal Box (57%), xG (46%), Pass Evaluation Metrics (44%), Space Control (33%), and Expected Possession Value (22%) .
Overall, rankings ranged between 2.6 and 3.4 on the Likert scale with no single KPI standing out from the rest. The top five valued KPIs were: Shots from the Penalty Area (2.6), Pass Evaluation Metrics (2.7), Shots on Goal (2.8), Shooting Efficiency (2.8), and Crosses (2.8). The lowest five valued KPIs were Shots from the Goal Box (2.9), xG (3.2), Ball Possession Metrics (3.2), Expected Possession Value (3.3), and Total Shots (3.4). Differences between roles for the use of KPIs
Chi-square tests revealed no significant difference between roles and KPI use except for the use of Pass Completion Percentage (p = 0.02, V = 0.26) and Pass Accuracy in the Opponent’s Half (p = 0.01, V = 0.29). For Pass Completion Percentage, 37% of Analysts and Scouts and 40% Coaches reported using it while only 9% of Assistant Coaches and 11% of Directors reported use. Regarding Pass Accuracy in the Opponent’s Half, 16% of Assistant Coaches use it compared to just one Analyst and Scout out of the rest of the entire sample of participants. Analysts and Scouts reported using some metrics more frequently than other groups, including 73% using Ball Possession metrics, with 48% of Analysts and Scouts using Passing Networks and 61% Total Passes per Game. Analysts and Scouts also used Space Control (39%) and Pass Evaluation Metrics (51%) more often than the other groups. However, only 20% of Analysts and Scouts reported using Expected Possession Value vs. 26% of Coaches. Differences between levels of competition for the use of KPIs
There was a significant difference (p < 0.001, V = 0.61) between levels of competition for the use of KPIs, ranging from Shots on Goal (p < 0.001, V = 0.42) to Passing Networks (p < 0.001, V = 0.74). Notably, practitioners from the higher levels including Federations and Professionals relied more on Expected Goals and Ball Possession Metrics than practitioners from the lower levels (Table 4). Table 4. Difference between levels of competition for use of KPIs.
Use of specific ball possession metrics
Sub-categories were created for Ball Possession Metrics and Pass Evaluation Metrics. For Ball Possession Metrics, Total Passes Per Game was used most (49%) followed closely by Total Passes in the Opponent’s Half (47%), Total Duration of Possession (46%), and Passing Networks (40%). Pass Accuracy in the Opponent’s Half was only used by 3% of participants.There was lower reported use for Pass Evaluation Metrics. Pass Completion Percentage was used the most (24%), followed by Packing (22%) and Pass Risk/Reward (17%). I-Mov was used by 10% of the participants, while D-Def was a mere .3%. Differences between roles for KPI rankings
The distribution of scores was not similar between roles for the value of different KPIs. Shots from the Penalty area were valued highest among all roles except for Directors. Although there was a slight pattern that Directors favoured Expected Goals (xG) and Analysts and Scouts favoured Pass Evaluation Metrics and Space Control, the Krustal-Wallis H test did not yield significant differences between groups (values ranging from p = 0.12, ε² = 0.04 for Space Control, to p = 0.99, ε² = 0.00 for Shots on Goal). Differences between levels of competition for KPI rankings
Only Penalty Box Entries (p = 0.04, ε² = 0.07) and Space Control (p = 0.02, ε² = 0.08) showed significant differences between groups. However, in support of the small effect sizes, Bonferroni post hoc analysis revealed no statistically significant differences between levels of competition for Penalty Box Entries or Space Control. None of the levels placed a high value on Total Shots, but Shots from the Penalty Area was valued favourably across all levels. Youth Academy Practitioners valued Space Control the highest while Semi-Professional and College practitioners valued Pass Evaluation Metrics the highest (Table 5). Table 5. Smaller numbers designate higher rankings. 1 represents the highest ranking while 7 represents the lowest.
The aim of the present study was to gain insight into current use and perceptions of different technologies and KPIs for measuring (tactical) performance in soccer. Compared to previous surveys, this novel approach consisted of a larger sample of diverse staff members from different levels including more top-level coaches (Akenhead and Nassis, 2016; Brink et al., 2018; Wright et al., 2012; Wright et al., 2013). The main findings of this study are that there are a variety of ways practitioners gather information and use and value both simple (e.g. Shots on Goal) and more sophisticated metrics (e.g. xG, EPV) for tactical analysis. Some of the differences are determined by the level of competition and the role of a practitioner within a club. The implementation and perceived value of newer KPIs offered by optical positional tracking technology was lower than anticipated. As suggested by previous findings (Brink et al., 2018), this could be explained by a financial restraint within clubs or skepticism towards the soccer-specific knowledge of a data scientist. Furthermore, these complex KPIs are often only published in scientific journals or presented at scientific conferences which may influence a lack of education and awareness among practitioners. Use and granularity of available data
As expected, a greater percentage of practitioners at the higher levels of elite soccer (approximately 70%) reported using data tools and applications compared to practitioners at the Youth Academy (60%) and Semi-Professional (37%) level. These findings resonate with the fact that data are acquired consistently by professional leagues (Pappalardo et al., 2019) and provided to clubs and federations. Although lower-tier clubs with limited funding (Setterwall, 2003) can purchase relatively low-cost GPS units instead of the high-price optical tracking to use several of the data tools, they might still lack the personnel to incorporate them. This could also explain the significant difference found between the use of event data technology and level of competition, with lower use evident in the Semi-Professional and Youth Academy levels. However, these results were still surprising as basic notational analysis can be performed with a normal camera and software (e.g. Hudl, Sportscode). Also, KPIs measured with such a setup are used on a wide basis in the media and coaching education. Therefore, one can assume a lack of buy-in to quantitate analysis of tactical performance in general by this peer group.The use of event data (83%) was more common than the use of optical positional tracking (75%). Along with higher monetary costs, this is possibly due to recent developments using positional tracking for tactical analysis and hence, a lack of familiarity amongst practitioners (Rein and Memmert, 2016b). In addition, positional tracking contains considerably more information. Thus, the aggregation of larger amounts of data into reasonable insights such as the interpretability of the underlying models requires greater refinement. Whereas data-science research often aims to derive new KPIs to understand tactical performance, this investigation supports earlier findings that there is a need to better simplify and visualise available KPIs in a straightforward way to coaches and practitioners (Carling et al., 2014). Otherwise, advanced KPIs and information provided by data-scientists and companies are not seen as an added value to practitioners. Moreover, approximately one-third of the participants (36%) rely on their own tagging to gather information. Practitioners may not trust the automated data provided by optical tracking technology and companies, or it fails to cover all of their needs. Interestingly, only 80% of practitioners from the professional level reported using wearable technology. This may reflect the fact that clubs rely on league-wide tracking (e.g. Stats, Tracab) during matches but depend more on wearable technology for training sessions. This supports a similar trend by the sports medicine and sports science departments of professional clubs who reported greater use of wearable technology for physiological data (and not tactical purposes) in training sessions compared to matches (Akenhead and Nassis, 2016). Use and value of KPIs
This survey revealed that KPIs are mostly used to analyse matches of a team weekly rather than monitoring training sessions. In addition to possible lack of time and interest by practitioners, there are technical and physical differences between training sessions and matches and that could justify the lower use of KPIs in training (Olthof et al., 2019). For instance, compared to 11 vs 11 training games, players in official matches completed fewer passes per minute and displayed more errors in passing, but covered greater distance and performed more sprints. However, while technical and physical parameters differ significantly, tactical performance is rather unaffected if comparing 11 vs 11 training games to official matches (Olthof et al., 2019). Given these findings, it might be beneficial to monitor tactical performance and close the gap between data used in matches and training. As several amateur and professional teams employ the use of small-sided games in training sessions (Halouani et al., 2014; Sarmento et al., 2018), researchers could scale KPIs to varying field dimensions and/or coaches can use variables that have a global meaning such as space control (Fernandez and Bornn, 2018) or defensive pressure (Andrienko et al., 2017). This could help evaluate a specific tactic or formation used in training as KPIs vary between formations in build-up play (Memmert et al., 2019).Principally, practitioners preferred rather simple KPIs based on event data with Shots on Goal as the best rated. As practitioners focus on these outcome (goal) related KPIs rather than process-related ones, it is even more understandable that they might not see the value in using KPIs during training. Aside from shooting-related KPIs, analysis of the specific Pass Evaluation Metrics showed Pass Completion Percentage was used the most, whilst more recently developed metrics based on optical tracking such as I-Mov, D-Def, and Pass Risk/Reward were used the least. Nonetheless, the average use of Pass Completion Percentage was still only 24% across all practitioners. Despite receiving media attention and research validating the concept of outplaying opponents (Rein et al., 2017), the use of Packing was only 22%. Regardless of the apparent lack of interest by practitioners, the evaluation of passing performance such as extrapolating styles of play (Bialkowski et al., 2014; Gyarmati et al., 2014) and placing value on specific passes (Bransen et al., 2019), remains a common focus by researchers using tracking data. However, the results of this study suggest a possible disconnect between research on tactical play and applied practice. One area of soccer that has been well researched is ball possession, with several studies based on event data having shown ball possession is linked to team success (Casal et al., 2017; Jones et al., 2004). In line with this, nearly half of practitioners (48%) reported usage of the more easily computed ball possession KPIs such as Total Duration of Possession. However, there was a clear distinction between roles as Analysts and Scouts reported using newer metrics (e.g Space Control) dependent upon positional data more often than Coaches, Assistant Coaches, and Directors. Analysts’ and Scouts’ implementation of more complex methods highlights their task within the team as well as the growing use of technology to enhance the feedback process in coaching (Rein and Memmert, 2016b; Wright et al., 2012). Nonetheless, there is a gap between work being done in computer science and the focus of analysts and scouts in a practical setting. Advances to improve data comprehension and reporting to the analysts and ultimately the coaching staff have begun with clubs and federations such as the German Football Association (DFB = Deutscher Fussball-Bund) hiring a data scientist. Furthermore, events such as hackathons and the Barcelona Innovation Hub function to educate coaches and analysts. Although clubs and federations are taking steps to meet this demand, as highlighted in this analysis, it will likely require further time and support to be adopted by semi-professional and youth levels. Besides the reported frequency, there were also differences in the importance placed on various KPIs per role. Other than their affinity for Expected Goals (xG), Directors’ overall ranking of KPIs was lowest compared to other roles. The perceived low value of KPIs by Directors was unexpected as it is often the function of the technical and/or coaching director to work with data to oversee and improve broad aspects of performance (Kasap and Kasap, 2005). Perhaps including a greater number of participants in the Directors group would have revealed higher value for KPIs, and presumably, the increase of data-driven approaches will start influencing the perspective of practitioners in these managerial positions. Compared to Assistant Coaches and Directors, Coaches and especially the Analysts and Scouts gave higher value to metrics relying on positional data including Pass Evaluation Metrics and Space Control, while devaluing Expected Goals (xG). Head coaches placing a higher value on complex metrics than Assistants was an unexpected finding, possibly representing a trend for Assistant Coaches to carry out the training sessions while Head Coaches communicate more often with the Analysts and Scouts. This gives Analysts and Scouts the chance to negotiate the use of KPIs with the coach to reflect the coach’s philosophy, strategy, and tactics (Wright et al., 2013). In general, across roles and levels of competition, practitioner’s responses revealed interest in the ability to evaluate passes. In contrast, the results revealed minimal use of more recent metrics (e.g. D-Def, Expected Possession Value) and the continued reliance on traditional methods of assessments in their practice. Other than goal-scoring, no gold-standard measure of soccer performance exists. Thus, practitioners turn to methods comprehensible to them to improve understanding of player and team performance. Furthermore, coaches primarily rely on coaching clinics and seminars with fellow coaches to further their development (Brink et al., 2018; Stoszkowski and Collins, 2016). These cultural and social influences on performance analysis must be considered in the promotion of new approaches (Groom et al., 2011) and perhaps coaching courses present an opportunity to bring awareness to coaches about data and analytics. Furthermore, Brink et al. (2018) reported that coaches appear most convinced about their tactical knowledge. They see this as their field of expertise, which might be the reason for a low buy-in into metrics that could from their perspective, challenge their position and authority. Therefore, continuing education provided to practitioners about the capabilities of new tracking technology is required. Before coaches and analysts start adopting newly available methods of analysing performance, another challenge to overcome is coaches’ perception that the scientists conducting research lack specific soccer knowledge (Brink et al., 2018). Furthermore, without the burdens of tedious statistical analysis and the publication process, ‘fast-moving practitioners’ more often rely on their knowledge and expertise to come up with new ideas and training methods before they can be validated (Coutts, 2016). Despite the push for greater use of quantitative methods to objectify the game, qualitative analysis is still at the crux of what coaches do (Nelson and Groom, 2012). Training methods and tactics continuously evolve around the use of space, time, and individual actions to win soccer games (Garganta, 2009). Along these lines, coaches’ input should be prioritized in the development of KPIs which represent success in the context of play. This includes knowledge about specific players, various playing styles, and making comparisons between opposing teams (Meerhoff et al., 2019). As such, one limitation of our study is the lack of KPI normalization. Thus, further studies could investigate how practitioners’ use of KPIs change depending on specific factors such as the strength of the opposition, the score line, or whether it was a home or away game. Despite the problems associated with KPI-driven science and practice, there has been a recent rise in the synergy between domains including the presence of coaches and analysts involved in research. For instance, the work by Linke et al. (2018), Rein et al. (2017), and Goes et al. (2018) serve as examples of sports science in which new features were developed and validated to assess tactical performance. Though predominately more from a computational perspective, work by Power et al. (2017), Spearman (2018), Andrienko et al., (2017), and Fernandez and Bornn (2018) still involved domain expertise from soccer. The ability to evaluate passes based on the likelihood of a pass creating a scoring chance versus being intercepted (Power et al., 2017), and measuring the probability that a player currently not in possession of the ball will score (Spearman, 2018), transcend data science and speak practitioners’ language. These efforts represent progress, but collaboration and education between practitioners and scientists must continue to go both ways. The interplay between computer science experts who can handle the vast amounts of data, and domain experts who can address the right questions, is a challenging task (Goes et al., 2020). Increased multi-disciplinary approaches including research groups and sports scientists competent in soccer will continue to be necessary to optimize KPI development and application. This includes the continued integration of data-scientists or data-literate match analysts embedded within the staff of clubs and federations. Future work should not be limited to developing more advanced KPIs but conduct intervention studies to further elucidate how already available KPIs can be used by practitioners in training as well as matches. Greater coach and analyst involvement in the research and development process increases the buy-in and the likelihood practitioners will interpret the relevant value of the information. In turn, this may improve the training process as well as performance on the pitch.
This study provides novel findings that demonstrate practitioners’ perception and implementation of key performance indicators. The results showed that most practitioners who participated in this survey see value in, and commonly use, technology in their tactical analysis and KPIs. Respondents reported greater use of event data (83%) and wearables (67%), while the use of position tracking data (52%) is still lagging. The low use of tracking data was also evident in the reporting of KPI usage and ranking, as practitioners most frequently use shooting related metrics that are gathered with event data (Shots on Goal, Shots from Penalty Area, Total Shots, Crosses, and Shooting Efficiency). Other than Pass Evaluation Metrics, which was ranked high despite low reported use, a similar trend was noted in their ranking of KPIs (Shots from the Penalty Area, Pass Evaluation Metrics, Shots on Goal, Shooting Efficiency, and Crosses). As some KPIs relying on tracking data show promise in the speed and quality of information they can provide, improvements in applied research, collaboration, and educational and financial resources are necessary. The integration of tactical KPIs into the training process and combined efforts between practitioners and researchers in the form of intervention studies are recommended. Further understanding practitioners’ performance goals and preferred methods of analysis could help toward implementing strategies to optimize the implementation of these newer methods of analysis into practice.
By MAT HEROLD , MATTHIAS KEMPE , PASCAL BAUER, TIM MEYER |
|||||||||||||||||||||||||||||||||||||||||||||||||||||||||||||||||||||||||||||||||||||||||||||||||||||||||||||||||||||||||||||||||||||||||||||||||||||||||||||||||||||||||||||||||||||||||||||||||||||||||||||||||||||||||||||||||||||||||||||||||||||||||||||||||||||||||||||||||||||||||||