
Easy assessment to know which statistical test to use
What does a statistical test do?
Statistical tests work by calculating a test statistic – a number that describes how much the relationship between variables in your test differs from the null hypothesis of no relationship.
It then calculates a p-value (probability value). The p-value estimates how likely it is that you would see the difference described by the test statistic if the null hypothesis of no relationship were true.
If the value of the test statistic is more extreme than the statistic calculated from the null hypothesis, then you can infer a statistically significant relationship between the predictor and outcome variables.
If the value of the test statistic is less extreme than the one calculated from the null hypothesis, then you can infer no statistically significant relationship between the predictor and outcome variables.
When to perform a statistical test
You can perform statistical tests on data that have been collected in a statistically valid manner – either through an experiment, or through observations made using probability sampling methods.
For a statistical test to be valid, your sample size needs to be large enough to approximate the true distribution of the population being studied.
To determine which statistical test to use, you need to know:
- whether your data meets certain assumptions.
- the types of variables that you’re dealing with.
Statistical assumptions
Statistical tests make some common assumptions about the data they are testing:
- Independence of observations (a.k.a. no autocorrelation): The observations/variables you include in your test are not related (for example, multiple measurements of a single test subject are not independent, while measurements of multiple different test subjects are independent).
- Homogeneity of variance: the variance within each group being compared is similar among all groups. If one group has much more variation than others, it will limit the test’s effectiveness.
- Normality of data: the data follows a normal distribution (a.k.a. a bell curve). This assumption applies only to quantitative data.
If your data do not meet the assumptions of normality or homogeneity of variance, you may be able to perform a nonparametric statistical test, which allows you to make comparisons without any assumptions about the data distribution.
If your data do not meet the assumption of independence of observations, you may be able to use a test that accounts for structure in your data (repeated-measures tests or tests that include blocking variables).
Types of variables
The types of variables you have usually determine what type of statistical test you can use.
Quantitative variables represent amounts of things (e.g. the number of trees in a forest). Types of quantitative variables include:
- Continuous (a.k.a ratio variables): represent measures and can usually be divided into units smaller than one (e.g. 0.75 grams).
- Discrete (a.k.a integer variables): represent counts and usually can’t be divided into units smaller than one (e.g. 1 tree).
Categorical variables represent groupings of things (e.g. the different tree species in a forest). Types of categorical variables include:
- Ordinal: represent data with an order (e.g. rankings).
- Nominal: represent group names (e.g. brands or species names).
- Binary: represent data with a yes/no or 1/0 outcome (e.g. win or lose).
Choose the test that fits the types of predictor and outcome variables you have collected (if you are doing an experiment, these are the independent and dependent variables). Consult the tables below to see which test best matches your variables.
Choosing a parametric test: regression, comparison, or correlation
Parametric tests usually have stricter requirements than nonparametric tests, and are able to make stronger inferences from the data. They can only be conducted with data that adheres to the common assumptions of statistical tests.
The most common types of parametric test include regression tests, comparison tests, and correlation tests.
Regression tests
Regression tests are used to test cause-and-effect relationships. They look for the effect of one or more continuous variables on another variable.
| Predictor variable | Outcome variable | Research question example | |
|---|---|---|---|
| Simple linear regression |
|
|
What is the effect of income on longevity? |
| Multiple linear regression |
|
|
What is the effect of income and minutes of exercise per day on longevity? |
| Logistic regression |
|
|
What is the effect of drug dosage on the survival of a test subject? |
Comparison tests
Comparison tests look for differences among group means. They can be used to test the effect of a categorical variable on the mean value of some other characteristic.
T-tests are used when comparing the means of precisely two groups (e.g. the average heights of men and women). ANOVA and MANOVA tests are used when comparing the means of more than two groups (e.g. the average heights of children, teenagers, and adults).
| Predictor variable | Outcome variable | Research question example | |
|---|---|---|---|
| Paired t-test |
|
|
What is the effect of two different test prep programs on the average exam scores for students from the same class? |
| Independent t-test |
|
|
What is the difference in average exam scores for students from two different schools? |
| ANOVA |
|
|
What is the difference in average pain levels among post-surgical patients given three different painkillers? |
| MANOVA |
|
|
What is the effect of flower species on petal length, petal width, and stem length? |
Correlation tests
Correlation tests check whether two variables are related without assuming cause-and-effect relationships.
These can be used to test whether two variables you want to use in (for example) a multiple regression test are autocorrelated.
| Predictor variable | Outcome variable | Research question example | |
|---|---|---|---|
| Pearson | Continuous | Continuous | How are latitude and temperature related? |
| Chi-Square | Categorical | Categorical | How is membership in a sports team related to membership in drama club among high school students? |
Choosing a nonparametric test
Non-parametric tests don’t make as many assumptions about the data, and are useful when one or more of the common statistical assumptions are violated. However, the inferences they make aren’t as strong as with parametric tests.
| Predictor variable | Outcome variable | Use in place of… | |
|---|---|---|---|
| Spearman |
|
|
Regression and correlation tests |
| Sign test |
|
|
T-test |
| Kruskal–Wallis |
|
|
ANOVA |
| ANOSIM |
|
|
MANOVA |
| Wilcoxon Rank-Sum test |
|
|
Independent t-test |
| Wilcoxon Signed-rank test |
|
|
Paired t-test |
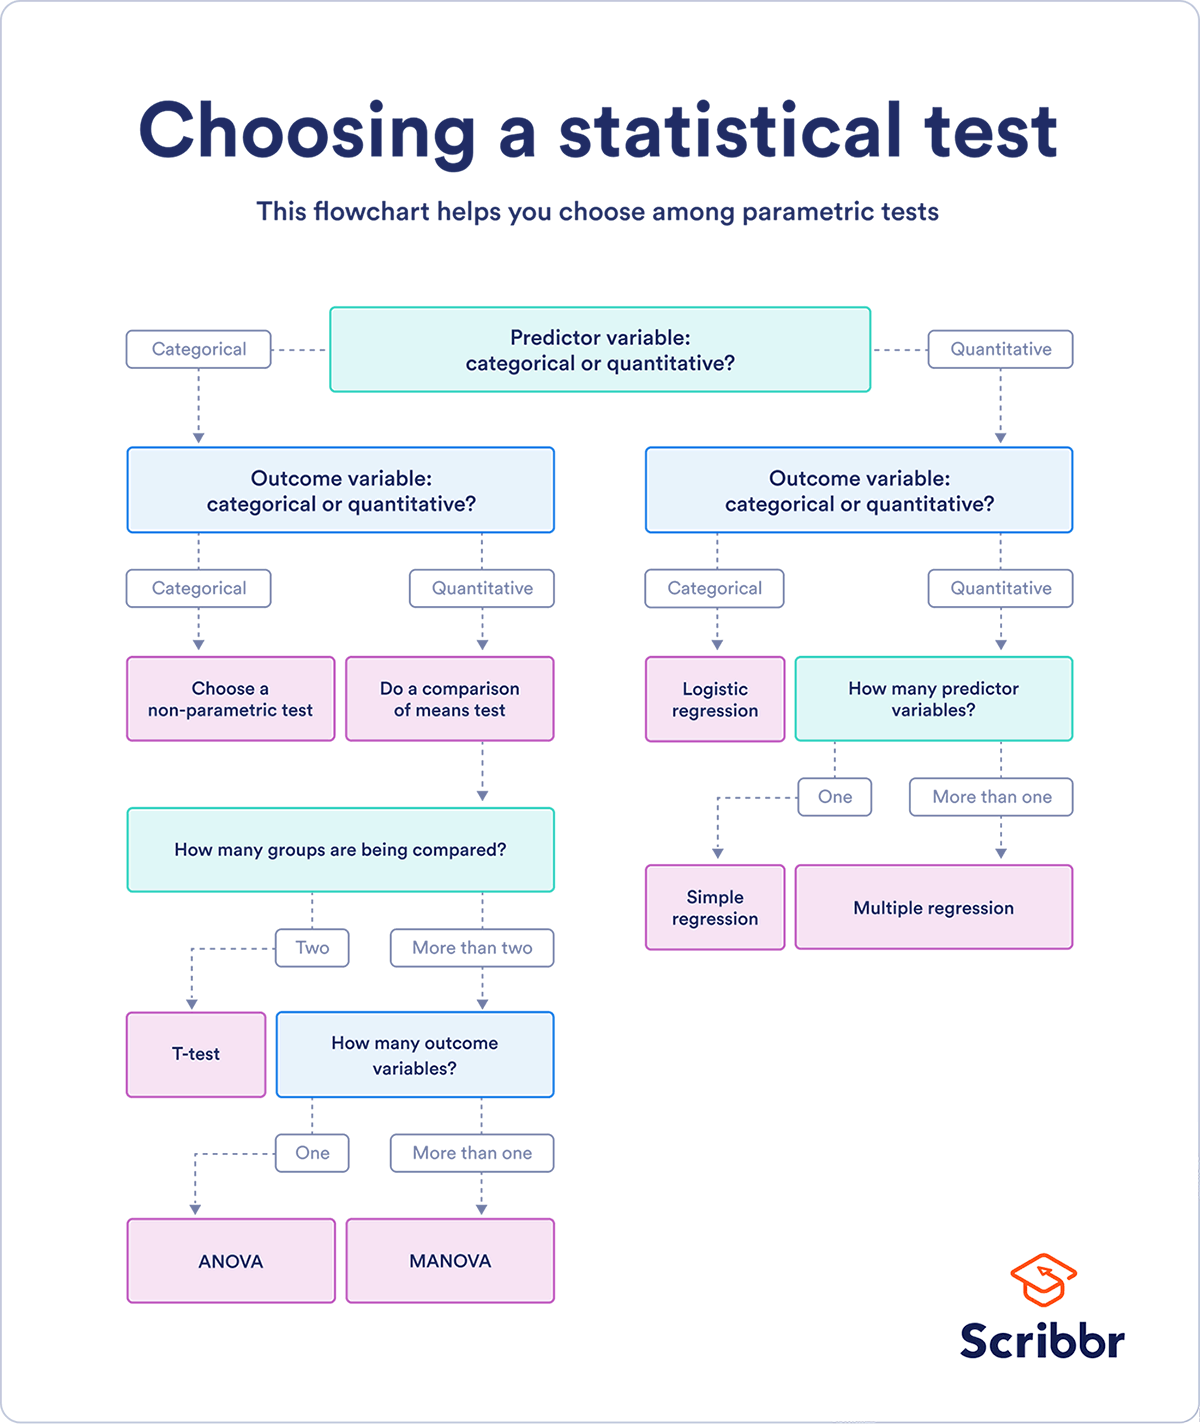
Flowchart: choosing a statistical test
This flowchart helps you choose among parametric tests. For nonparametric alternatives, check the table above.